A Step-by-Step Guide to K-Nearest Neighbors (KNN) in Machine Learning
<h2> Introduction </h2> <p>Welcome back, everyone, to the 3rd blog post in our <a href="https://dev.to/cc-keh/series/37678">Machine Learning Algorithms Series</a>! Today, we'll dive into K-Nearest Neighbors (KNN), a fundamental algorithm in machine learning. We'll be implementing the KNN algorithm from scratch in Python. By the end of this blog, you'll have a clear understanding of how KNN works, how to implement it, and when to use it. Let's get started!</p> <h2> What is KNN? </h2> <p>K-Nearest Neighbors (KNN) is a straightforward powerful supervised machine learning algorithm used for both classification and regression tasks. Its simplicity lies in its non-parametric nature, meaning it doesn't assume anything about the underlying data distribution. Instead, KNN works by finding the 'k' c
Introduction
Welcome back, everyone, to the 3rd blog post in our Machine Learning Algorithms Series! Today, we'll dive into K-Nearest Neighbors (KNN), a fundamental algorithm in machine learning. We'll be implementing the KNN algorithm from scratch in Python. By the end of this blog, you'll have a clear understanding of how KNN works, how to implement it, and when to use it. Let's get started!
What is KNN?
K-Nearest Neighbors (KNN) is a straightforward powerful supervised machine learning algorithm used for both classification and regression tasks. Its simplicity lies in its non-parametric nature, meaning it doesn't assume anything about the underlying data distribution. Instead, KNN works by finding the 'k' closest data points (neighbors) in the training dataset to a new input point and making predictions based on these neighbors.
For classification tasks, KNN predicts the class label of the new data point by a majority vote among its nearest neighbors. The class label that appears most frequently among the nearest neighbors is assigned to the new data point.
For regression tasks, KNN predicts the value of the new data point by taking the average of the values of its nearest neighbors. This average value serves as the predicted output for the new data point.
Step by Step Implementation
Code is available on GitHub.
Importing Necessary Libraries
We start by importing the necessary libraries. These help us handle data, compute distances, and visualize results.
import numpy as np from collections import Counter from sklearn.model_selection import train_test_split from sklearn.datasets import make_regression, make_classification import matplotlib.pyplot as plt from matplotlib.colors import ListedColormapimport numpy as np from collections import Counter from sklearn.model_selection import train_test_split from sklearn.datasets import make_regression, make_classification import matplotlib.pyplot as plt from matplotlib.colors import ListedColormapEnter fullscreen mode
Exit fullscreen mode
-
numpy: For numerical operations. Counter: For counting occurrences of elements.
-
train_test_split: To split data into training and testing sets.
-
make_regression and make_classification: To generate synthetic datasets.
-
matplotlib: For plotting.
Defining the Euclidean Distance Function
This function calculates the Euclidean distance between two points. It’s essential for determining the nearest neighbors.
def euclidean_distance(x1, x2): return np.sqrt(np.sum((x1 - x2) ** 2))def euclidean_distance(x1, x2): return np.sqrt(np.sum((x1 - x2) ** 2))Enter fullscreen mode
Exit fullscreen mode
Implementing the KNN Class
The KNN class encapsulates the algorithm’s logic.
Initialization
The init method initializes the KNN class with the number of neighbors k and a flag isclassifier to indicate whether the task is classification or regression.
class KNN: def __init__(self, isclassifier, k=3): self.k = k self.isclassifier = isclassifierclass KNN: def __init__(self, isclassifier, k=3): self.k = k self.isclassifier = isclassifierEnter fullscreen mode
Exit fullscreen mode
Training
The fit method stores the training data. There’s no complex training process in KNN—just storing the data.
def fit(self, x, y): self.x_train = x self.y_train = ydef fit(self, x, y): self.x_train = x self.y_train = yEnter fullscreen mode
Exit fullscreen mode
Prediction
The predict method generates predictions for the test data by calling predict_single for each test point.
def predict(self, X): self.x_test = X predictions = [self._predict_single(x) for x in X] return predictionsdef predict(self, X): self.x_test = X predictions = [self._predict_single(x) for x in X] return predictionsEnter fullscreen mode
Exit fullscreen mode
Single Prediction
The _predict_single method calculates distances from the test point to all training points, finds the k nearest neighbors, and makes predictions based on the type of task (classification or regression)._
def predict_single(self, x1):
Find distance between x1 and all other points of x_train
distances = [euclidean_distance(x1, x2) for x2 in self.x_train]
Sort the distances, and get the index of top k points closest to x1.
k_indices = np.argsort(distances)[:self.k] k_nearest_nbrs = [self.y_train[i] for i in k_indices]
if self.isclassifier: prediction = Counter(k_nearest_nbrs).most_common() return prediction[0][0] else: return np.mean(k_nearest_nbrs)`
Enter fullscreen mode
Exit fullscreen mode
Main Function for Testing
This section tests our KNN implementation with both classification and regression tasks.
Classification Task
if __name__ == "__main__": cmap = ListedColormap(["#FF0000", "#00FF00", "#0000FF"])if __name__ == "__main__": cmap = ListedColormap(["#FF0000", "#00FF00", "#0000FF"])Classification
X, y = make_classification(n_samples=100, n_features=2, n_informative=2, n_redundant=0, n_clusters_per_class=1, random_state=44) x_train, x_test, y_train, y_test = train_test_split(X, y, random_state=42)
classifier = KNN(isclassifier=True, k=5) classifier.fit(x_train, y_train) preds = classifier.predict(x_test)
accuracy = np.sum(preds == y_test) / len(y_test) print("On Classification Task") print("Accuracy:", accuracy)`
Enter fullscreen mode
Exit fullscreen mode
-
Data Generation: Creates a synthetic dataset for classification.
-
Data Splitting: Splits the data into training and testing sets.
-
Training: Stores the training data in KNN classifier object.
-
Prediction and Accuracy: Predicts the labels for the test set and calculates accuracy.
Regression Task
# Regression X, y = make_regression(n_samples=100, n_features=1, noise=0.1) x_train, x_test, y_train, y_test = train_test_split(X, y, random_state=42)# Regression X, y = make_regression(n_samples=100, n_features=1, noise=0.1) x_train, x_test, y_train, y_test = train_test_split(X, y, random_state=42)regressor = KNN(isclassifier=False, k=5) regressor.fit(x_train, y_train)
rmse = np.sqrt(np.mean((y_test - regressor.predict(x_test)) ** 2)) print("On Regression Task") print("RMSE:", rmse)`**
Enter fullscreen mode
Exit fullscreen mode
-
Data Generation: Creates a synthetic dataset for regression.
-
Data Splitting: Splits the data into training and testing sets.
-
Training: Trains the KNN regressor.
-
Prediction and RMSE: Predicts the values for the test set and calculates Root Mean Squared Error (RMSE).
Output
Our KNN algorithm seems to be performing quite well on both Classification and Regression tasks.
Common Misconceptions about KNN
-
KNN is always accurate: KNN can be effective but is sensitive to noise and irrelevant features. Proper feature selection and preprocessing are essential.
-
KNN works well with high-dimensional data: In high-dimensional spaces, the concept of distance becomes less meaningful (curse of dimensionality).
-
KNN is computationally efficient: Prediction can be slow for large datasets due to the need to calculate distances to all training points. Techniques like KD-Trees can help.
When to Apply K-Nearest Neighbors: Key Points to Consider
1. Type of Task: Classification or Regression
-
Classification: Classifying a new sample based on the majority class of its nearest neighbors.
-
Regression: Predicting a continuous value based on the average value of its nearest neighbors.
2. Dataset Size and Dimensionality
-
Small to Medium-Sized Datasets: KNN works well with small to medium-sized datasets.
-
Low to Moderate Dimensionality: KNN performs best in low to moderate dimensions.
3. Data Distribution
-
Locally Homogeneous Data: KNN assumes that nearby points are similar.
-
Smooth Decision Boundaries: Effective when decision boundaries between classes are smooth.
4. No Assumption of Data Distribution
- Non-Parametric Nature: KNN makes no assumptions about data distribution, making it flexible and model-free.
Advantages of KNN
-
Simplicity: Easy to understand and implement.
-
Versatility: Suitable for both classification and regression tasks.
-
No Training Phase: No complex training process—just storing the dataset.
Disadvantages of KNN
-
Computationally Intensive: Prediction can be slow for large datasets.
-
Sensitivity to Irrelevant Features: All features contribute equally, which can be problematic if some features are irrelevant.
-
Curse of Dimensionality: Performance degrades in high-dimensional spaces.
Practical Applications
-
Image Recognition: KNN can be used for tasks like handwritten digit recognition.
-
Recommender Systems: Helps in collaborative filtering by finding similar users or items.
-
Medical Diagnosis: Assists in diagnosing diseases based on historical patient data.
Conclusion
I hope this guide has been helpful and encourages you to explore and experiment further with K-Nearest Neighbors (KNN). If you like this blog please leave a like and a follow, you can also checkout my other blogs on machine learning algorithms, I have been posting these blogs in a series, hope you like them.
Dev.to AI
https://dev.to/cc-keh/a-step-by-step-guide-to-k-nearest-neighbors-knn-in-machine-learning-40g2Sign in to highlight and annotate this article
Conversation starters
Daily AI Digest
Get the top 5 AI stories delivered to your inbox every morning.
More about
modeltrainingavailable
Video generation with realistic motion
We seem to be experiencing a surge of video generation tools, models, and applications. However, video generation models generally struggle with some basic physics, like realistic walking motion. This leaves some generated videos lacking true motion with disappointing, simplistic panning camera views. Genmo is focused on the motion side of video generation and has released some of the best open models. Paras joins us to discuss video generation and their journey at Genmo. Sponsors: Domo – The AI and data products platform. Strengthen your entire data journey with Domo’s AI and data products. Featuring: Paras Jain – LinkedIn , X Chris Benson – Website , GitHub , LinkedIn , X Daniel Whitenack – Website , GitHub , X Show Notes: Genmo Upcoming Events: Register for upcoming webinars here ! ]]>

Deep-dive into DeepSeek
There is crazy hype and a lot of confusion related to DeepSeek’s latest model DeepSeek R1. The products provided by DeepSeek (their version of a ChatGPT-like app) has exploded in popularity. However, ties to China have raised privacy and geopolitical concerns. In this episode, Chris and Daniel cut through the hype to talk about the model, privacy implications, running DeepSeek models securely, and what this signals for open models in 2025. Sponsors: Notion – Notion is a place where any team can write, plan, organize, and rediscover the joy of play. It’s a workspace designed not just for making progress, but getting inspired. Notion is for everyone — whether you’re a Fortune 500 company or freelance designer, starting a new startup or a student juggling classes and clubs. Domo – The AI and
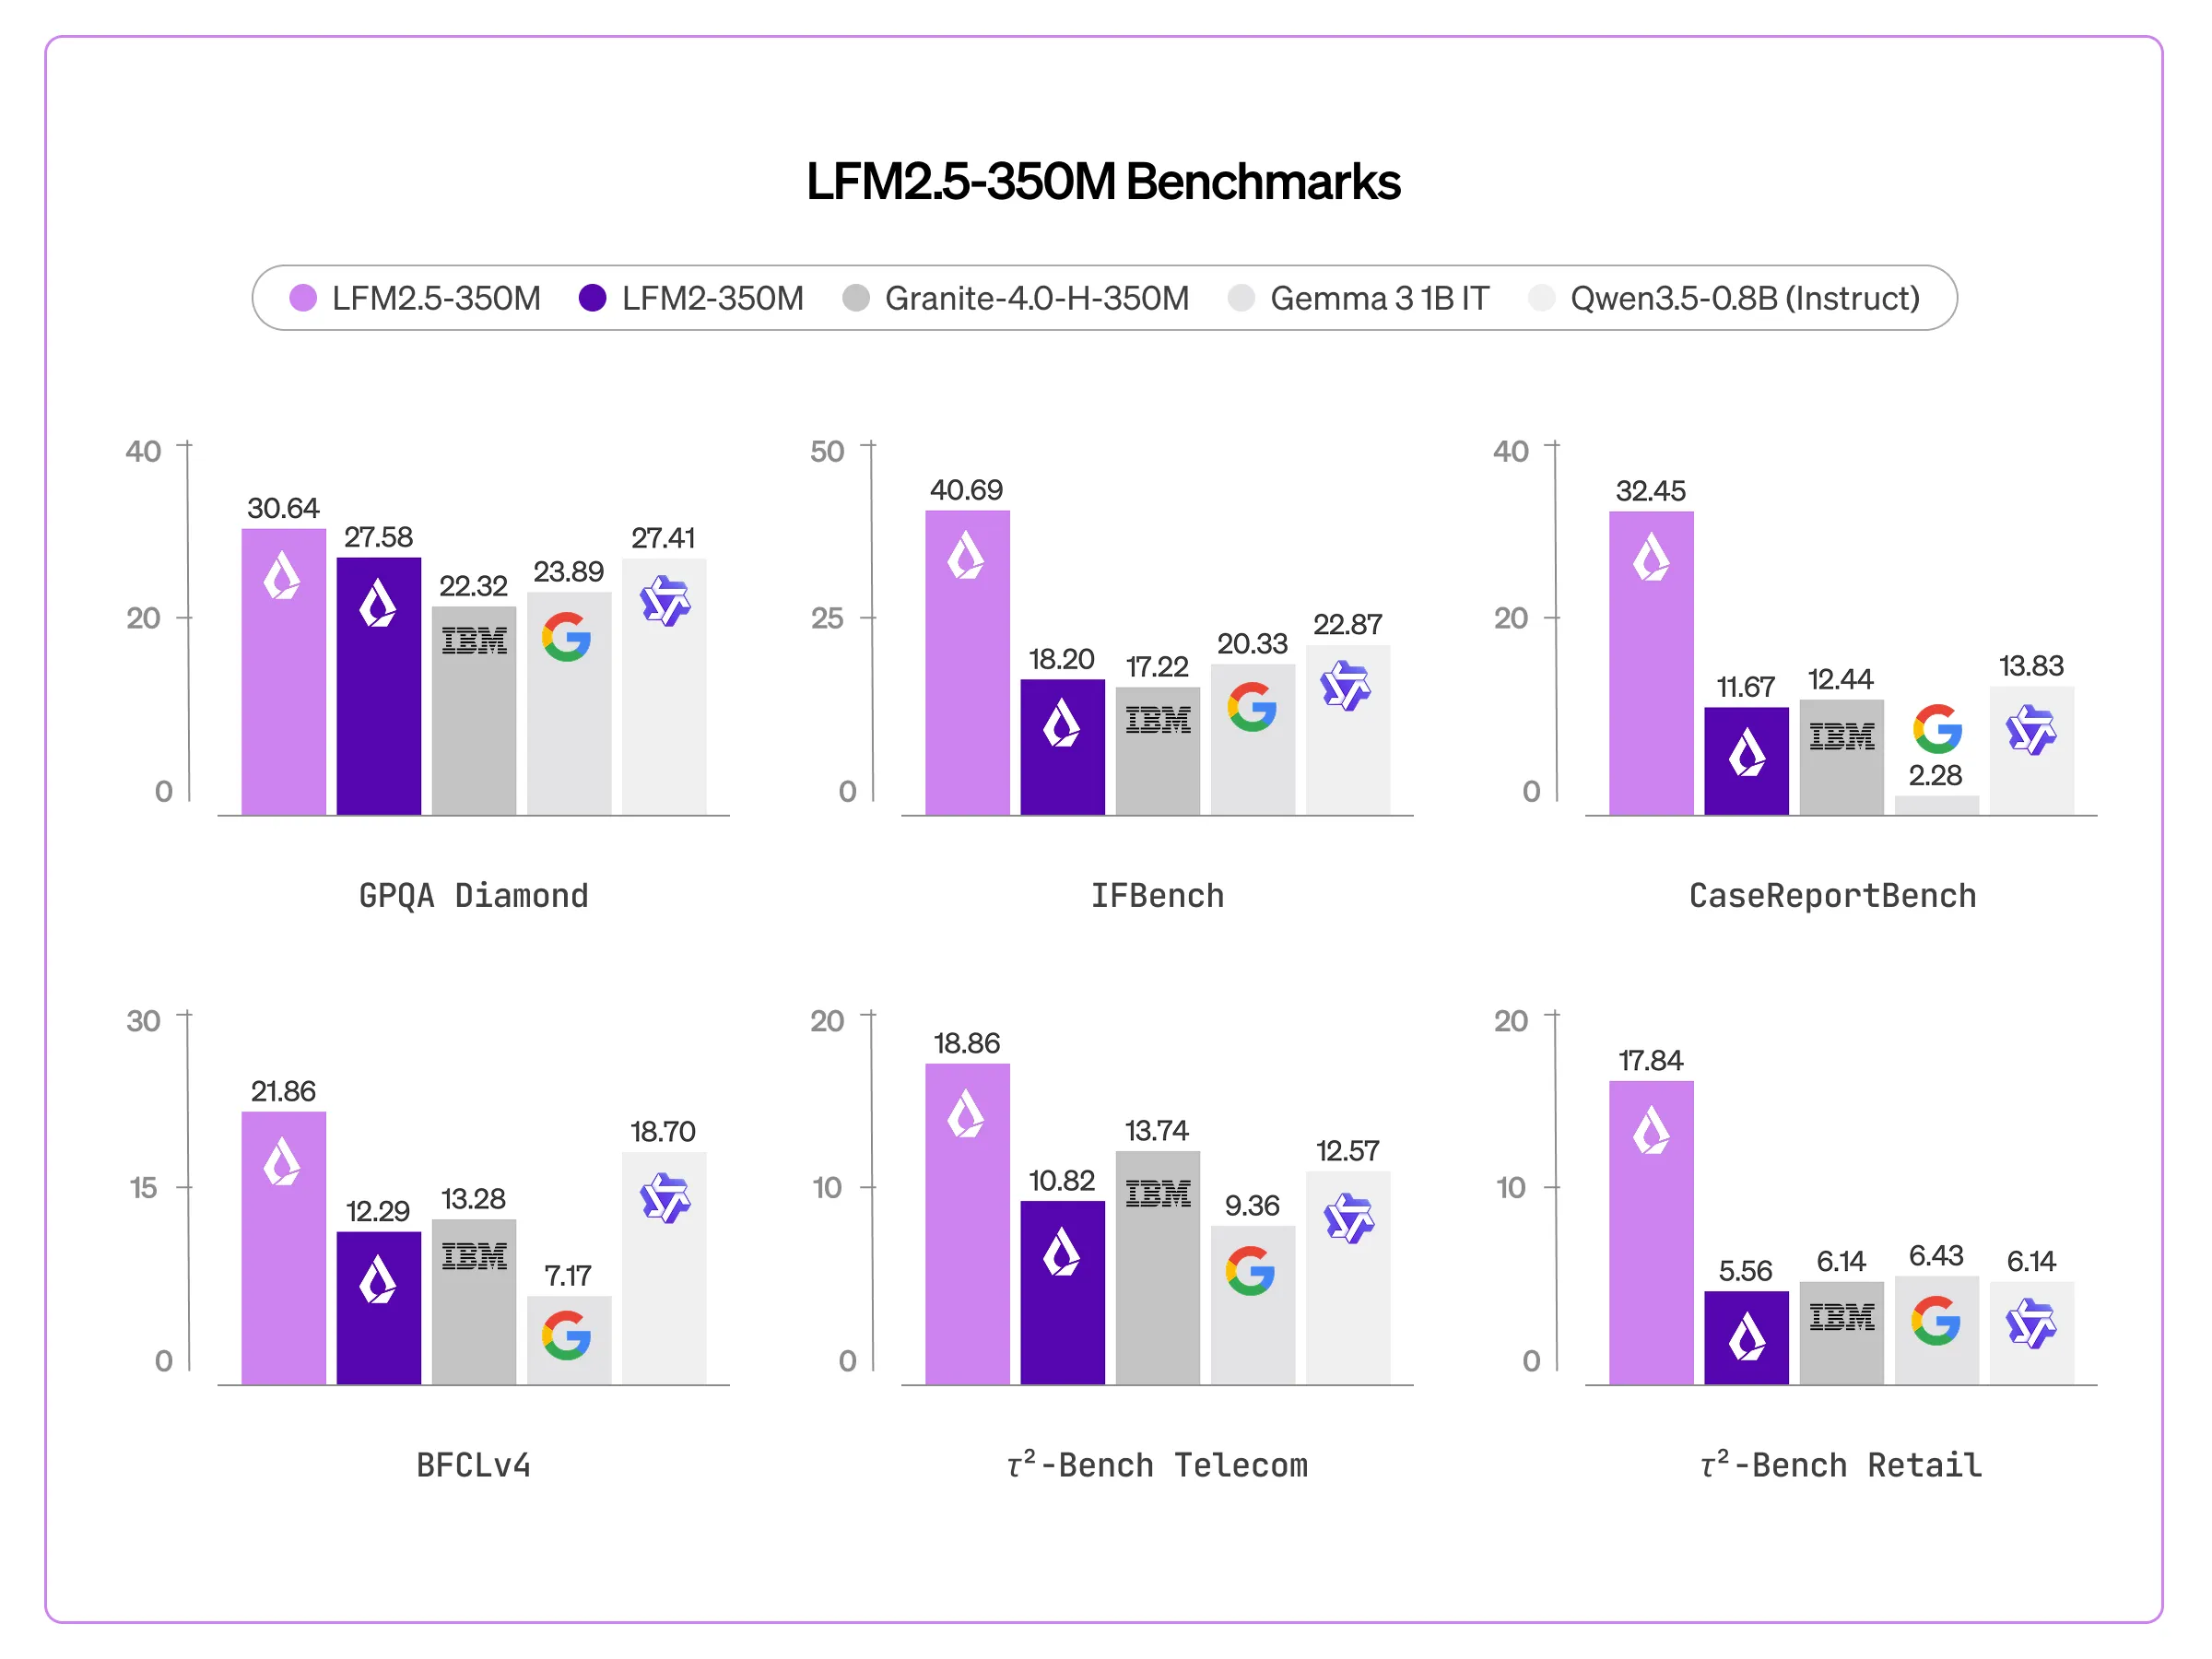
Liquid AI Released LFM2.5-350M: A Compact 350M Parameter Model Trained on 28T Tokens with Scaled Reinforcement Learning
In the current landscape of generative AI, the ‘scaling laws’ have generally dictated that more parameters equal more intelligence. However, Liquid AI is challenging this convention with the release of LFM2.5-350M. This model is actually a technical case study in intelligence density with additional pre-training (from 10T to 28T tokens) and large-scale reinforcement learning The […] The post Liquid AI Released LFM2.5-350M: A Compact 350M Parameter Model Trained on 28T Tokens with Scaled Reinforcement Learning appeared first on MarkTechPost .
Knowledge Map
Connected Articles — Knowledge Graph
This article is connected to other articles through shared AI topics and tags.
More in Products
Video generation with realistic motion
We seem to be experiencing a surge of video generation tools, models, and applications. However, video generation models generally struggle with some basic physics, like realistic walking motion. This leaves some generated videos lacking true motion with disappointing, simplistic panning camera views. Genmo is focused on the motion side of video generation and has released some of the best open models. Paras joins us to discuss video generation and their journey at Genmo. Sponsors: Domo – The AI and data products platform. Strengthen your entire data journey with Domo’s AI and data products. Featuring: Paras Jain – LinkedIn , X Chris Benson – Website , GitHub , LinkedIn , X Daniel Whitenack – Website , GitHub , X Show Notes: Genmo Upcoming Events: Register for upcoming webinars here ! ]]>
Deep-dive into DeepSeek
There is crazy hype and a lot of confusion related to DeepSeek’s latest model DeepSeek R1. The products provided by DeepSeek (their version of a ChatGPT-like app) has exploded in popularity. However, ties to China have raised privacy and geopolitical concerns. In this episode, Chris and Daniel cut through the hype to talk about the model, privacy implications, running DeepSeek models securely, and what this signals for open models in 2025. Sponsors: Notion – Notion is a place where any team can write, plan, organize, and rediscover the joy of play. It’s a workspace designed not just for making progress, but getting inspired. Notion is for everyone — whether you’re a Fortune 500 company or freelance designer, starting a new startup or a student juggling classes and clubs. Domo – The AI and

What 100% Test Coverage Can't Measure
<h1> What 100% Test Coverage Can't Measure </h1> <p>Customers started asking us: "How do you evaluate test quality? What does your evaluation look like?" We had coverage numbers - line, branch, function - and we were driving files to 100%. But we didn't have a good answer for what happens after 100%. Coverage proves every line was exercised. It doesn't say whether the tests are actually good.</p> <h2> Coverage Is the Foundation </h2> <p>Coverage tells you which lines ran during testing. That's important. A file at 30% coverage has obvious blind spots. Driving it to 100% forces tests to exercise error branches, conditional paths, and edge cases that might otherwise be ignored. We treat coverage as the primary goal and spend most of our effort getting files there.</p> <p>But coverage measure
How We Finally Solved Test Discovery
<h1> How We Finally Solved Test Discovery </h1> <p>Yesterday I wrote about <a href="https://gitauto.ai/blog/why-our-test-writing-agent-wasted-12-iterations-reading-files?utm_source=devto&utm_medium=referral" rel="noopener noreferrer">why test file discovery is still unsolved</a>. Three approaches (stem matching, content grepping, hybrid), each failing differently. The hybrid worked best but had a broken ranking function - flat scoring that gave <code>src/</code> the same weight as <code>src/pages/checkout/</code>. Today it's solved.</p> <h2> The Problem With Flat Scoring </h2> <p>The March 30 post ended with this bug: <code>+30</code> points for any shared parent directory. One shared path component got the same bonus as three. With 3 synthetic inputs, other factors dominated. With 29
Discussion
Sign in to join the discussion
No comments yet — be the first to share your thoughts!